@Deyse SJ de Assis - Lisboa, Portugal
🧠 Educational content • Interactive quizzes
Mathematics EN 9th grade >>
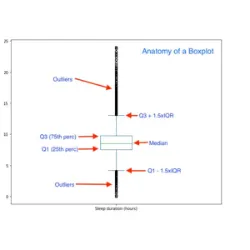
Boxplot Analysis & Grouped Quartiles
What to analyze?
Median → center of the data
Interquartile range (IQR) → central dispersion

Symmetry:
Centered median → symmetric distribution.
Shifted median → asymmetry.
📌 Identification of outliers.
Values far from the quartiles may be considered extreme.
Quartiles for Grouped Data
When data is in classes (intervals), quartiles are estimated using cumulative frequencies.
👉 Idea:
Find the position of the quartile.
Identify the corresponding class.
Interpolate within the interval.
📌 General steps:
1) Calculate the total frequency.
2) Determine the position of the quartile:
\( Q1 \rightarrow \frac{n}{4} \)
\( Q2 \rightarrow \frac{n}{2} \)
\( Q3 \rightarrow \frac{3n}{4} \)
3) Use the cumulative frequency to locate the class
4) Interpolate to obtain the approximate value
Did you know?