Population and Sample
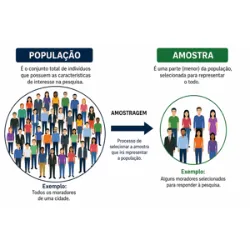
1. STATISTICAL POPULATION
Definition:
The statistical population is the set of all elements we want to study.
📌 It can include:
People;
Objects;
Animals;
Data.
📌 Examples:
All students in a school.
All inhabitants of a city.
All parts produced in a factory.
📌 Example: If we want to study the height of the students in a class, the population is all the students.
👉 Represents the whole of the study.
2. SAMPLE
Definition: A sample is a subset of the population.
👉 It is used when it is not possible to study all elements.
📌 Example: A school has 500 students, but we only study 50.
👉 The 50 students are the sample.
3. RELATIONSHIP BETWEEN POPULATION AND SAMPLE
📌 Example: Population = 1000 people. Sample = 100 people.
👉 Sample proportion:
\( \frac{100}{1000} = \frac{1}{10} \)
4. RELATIVE FREQUENCY
📌 Formula:
\( \text{relative frequency} = \frac{\text{absolute frequency}}{\text{total data}} \)
📌 Example:
5 students like math out of a total of 20.
\( \frac{5}{20} = \frac{1}{4} \)
5. PERCENTAGE
📌 Formula:
\( \text{percentage} = \text{relative frequency} \times 100 \)
📌 Example:
\( \frac{1}{4} \times 100 = 25 \)
👉 25%
6. AVERAGE (IN THE SAMPLE)
📌 Formula:
\( \text{average} = \frac{\text{sum of values}}{\text{number of values}} \)
📌 Example:
Values: 10, 12, 14
\( \frac{10 + 12 + 14}{3} = \frac{36}{3} = 12 \)
Did you know?