@Deyse SJ de Assis - Lisboa, Portugal
🧠 Educational content • Interactive quizzes
Mathematics EN 9th grade >>
Histograms
What is it?
A histogram is a bar chart that represents the distribution of data grouped into classes (intervals).
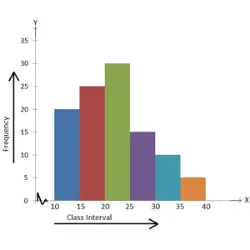
👉 Each bar represents the frequency of an interval of values.
📌 Characteristics:
Horizontal axis → intervals (classes).
Vertical axis → frequency.
Bars touching (no gaps).
Height of the bar = frequency.
📌 Example:
Heights (in cm):
Intervals:
150−160 → 5 students.
160−170 → 10 students.
170−180 → 3 students.
👉 Each interval corresponds to one bar in the histogram.
Did you know?