@Deyse SJ de Assis - Lisboa, Portugal
🧠 Educational content • Interactive quizzes
Mathematics EN 9th grade >>
Cumulative Frequency Polygon
What is it?
It is a graph that represents the cumulative frequency of the data.
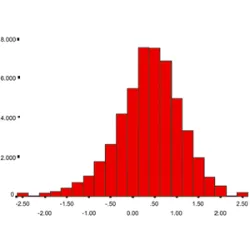
👉 It shows how many values are below a certain limit.
📌 Characteristics:
Horizontal axis → class limits.
Vertical axis → cumulative frequency.
Increasing line.
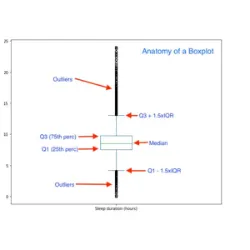
📌 What is it used for?
Finding quartiles.
Analyzing cumulative distribution.
Identifying percentiles.
Did you know?